[Atlassian Cloud], [Enterprise Teams], [Atlassian Analytics]
Atlassian Analytics is specifically designed for Cloud Enterprise customers who use Jira Software, Jira Service Management, or Confluence.
What is Atlassian Analytics?
Atlassian Analytics provides straightforward and adaptable methods to visually represent data from various sources, including Atlassian products and other data sources. It offers comprehensive insights into team workflows, enabling a holistic understanding of work processes. Key features of Atlassian Analytics include:
- Pre-designed templates tailored for service management, asset management, content management, and DevOps use cases
- Flexible data analysis with a powerful visual SQL interface
- Various visualization options, such as tables, pie charts, bar charts, and more
- Database connectors that allow querying of non-Atlassian data sources like Snowflake, Amazon Redshift, Google BigQuery, Microsoft SQL Server, PostgreSQL, and others
- Collaboration features, including embedding, commenting, and granular permission management for individual charts
Why use Atlassian Analytics?
Enhance decision-making efficiency across DevOps, IT service management, and business teams by leveraging data from Jira Software, Jira Service Management (including Assets), Opsgenie, Jira Work Management, and Confluence within Atlassian Analytics.
DevOps
Gain insights into the value delivered to customers through the development cycle.
- Evaluate the flow of work and the team's focus on committed issues
- Measure the ratio of defects and bugs to the total number of completed issues within a specific timeframe
- Track lead time, cycle time, and work distribution using Flow Analytics
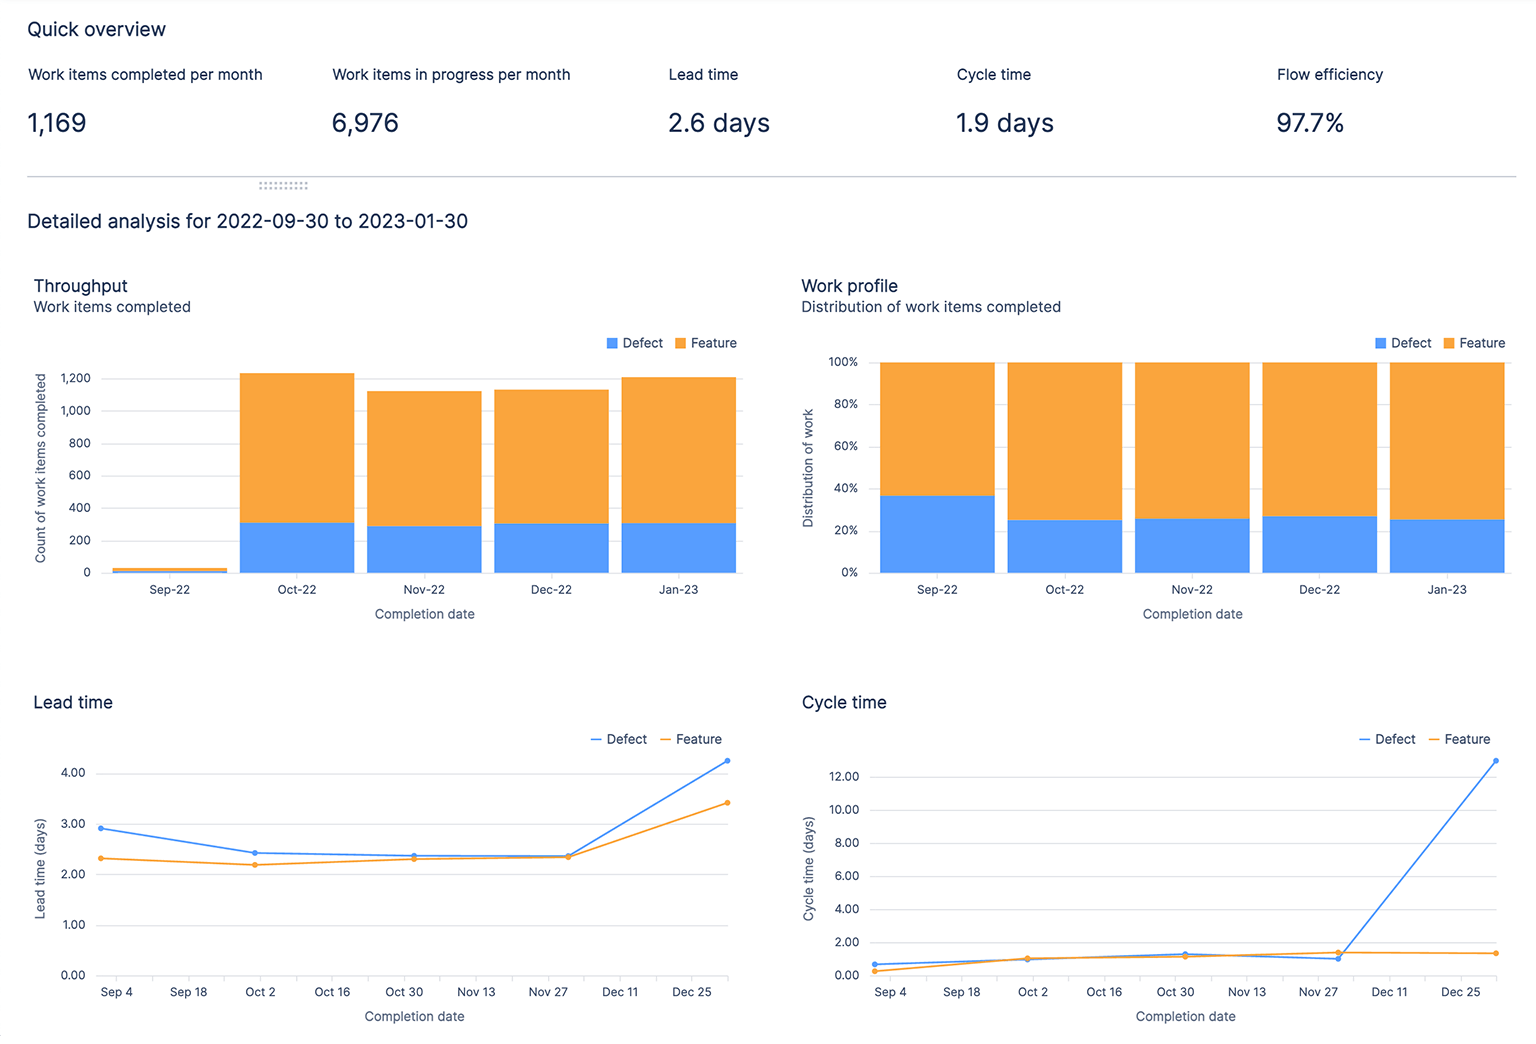
Screenshot of a flow analytics dashboard
- Proactively identify potential project blockers during the development cycle
- Assess the impact of issues at both project and organizational levels
- Monitor issue and project status based on age, assignee, and priority
- Effortlessly track risks, status, priority, and time-to-resolution
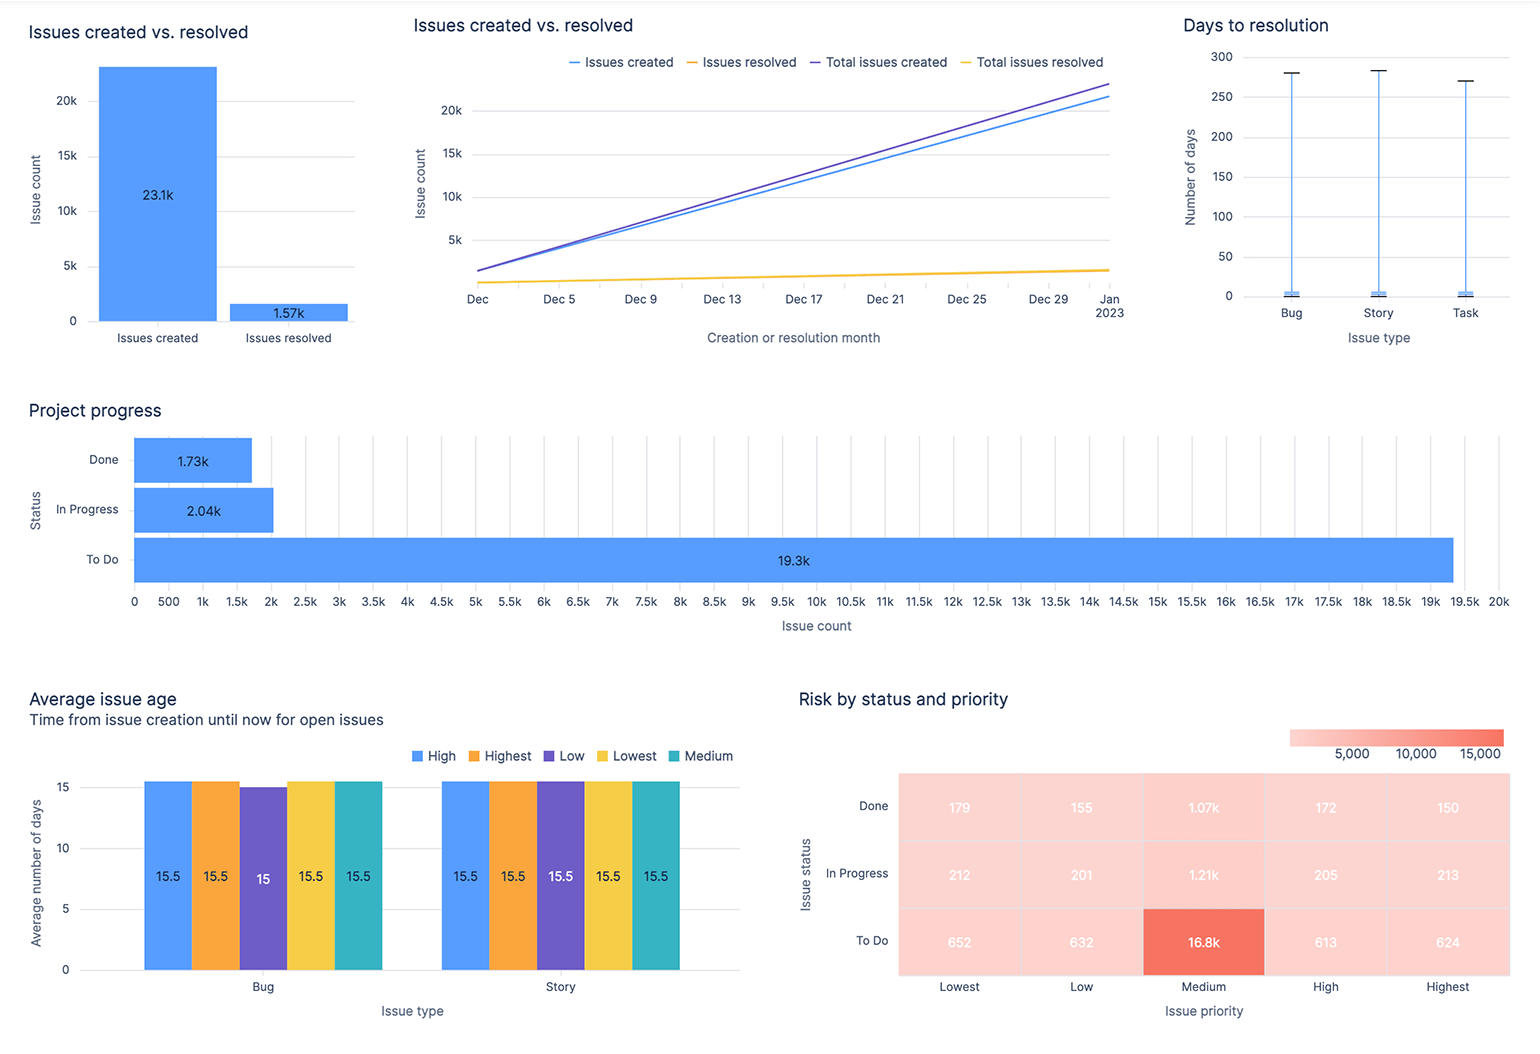
Screenshot of a Jira project overview dashboard
IT Service Management
Monitor and resolve service blockers that hinder time-to-value for customers. Track essential metrics related to change, incident, and request management.
- Track open requests, agent workload, adherence to SLAs, and customer satisfaction
- Analyze incident creation trends, response times, and resolution timelines
- Monitor change request resolution trends over time based on different risks, types, and services
- Analyze objects in your asset and configuration management system, along with related issues, projects, and time spent on them
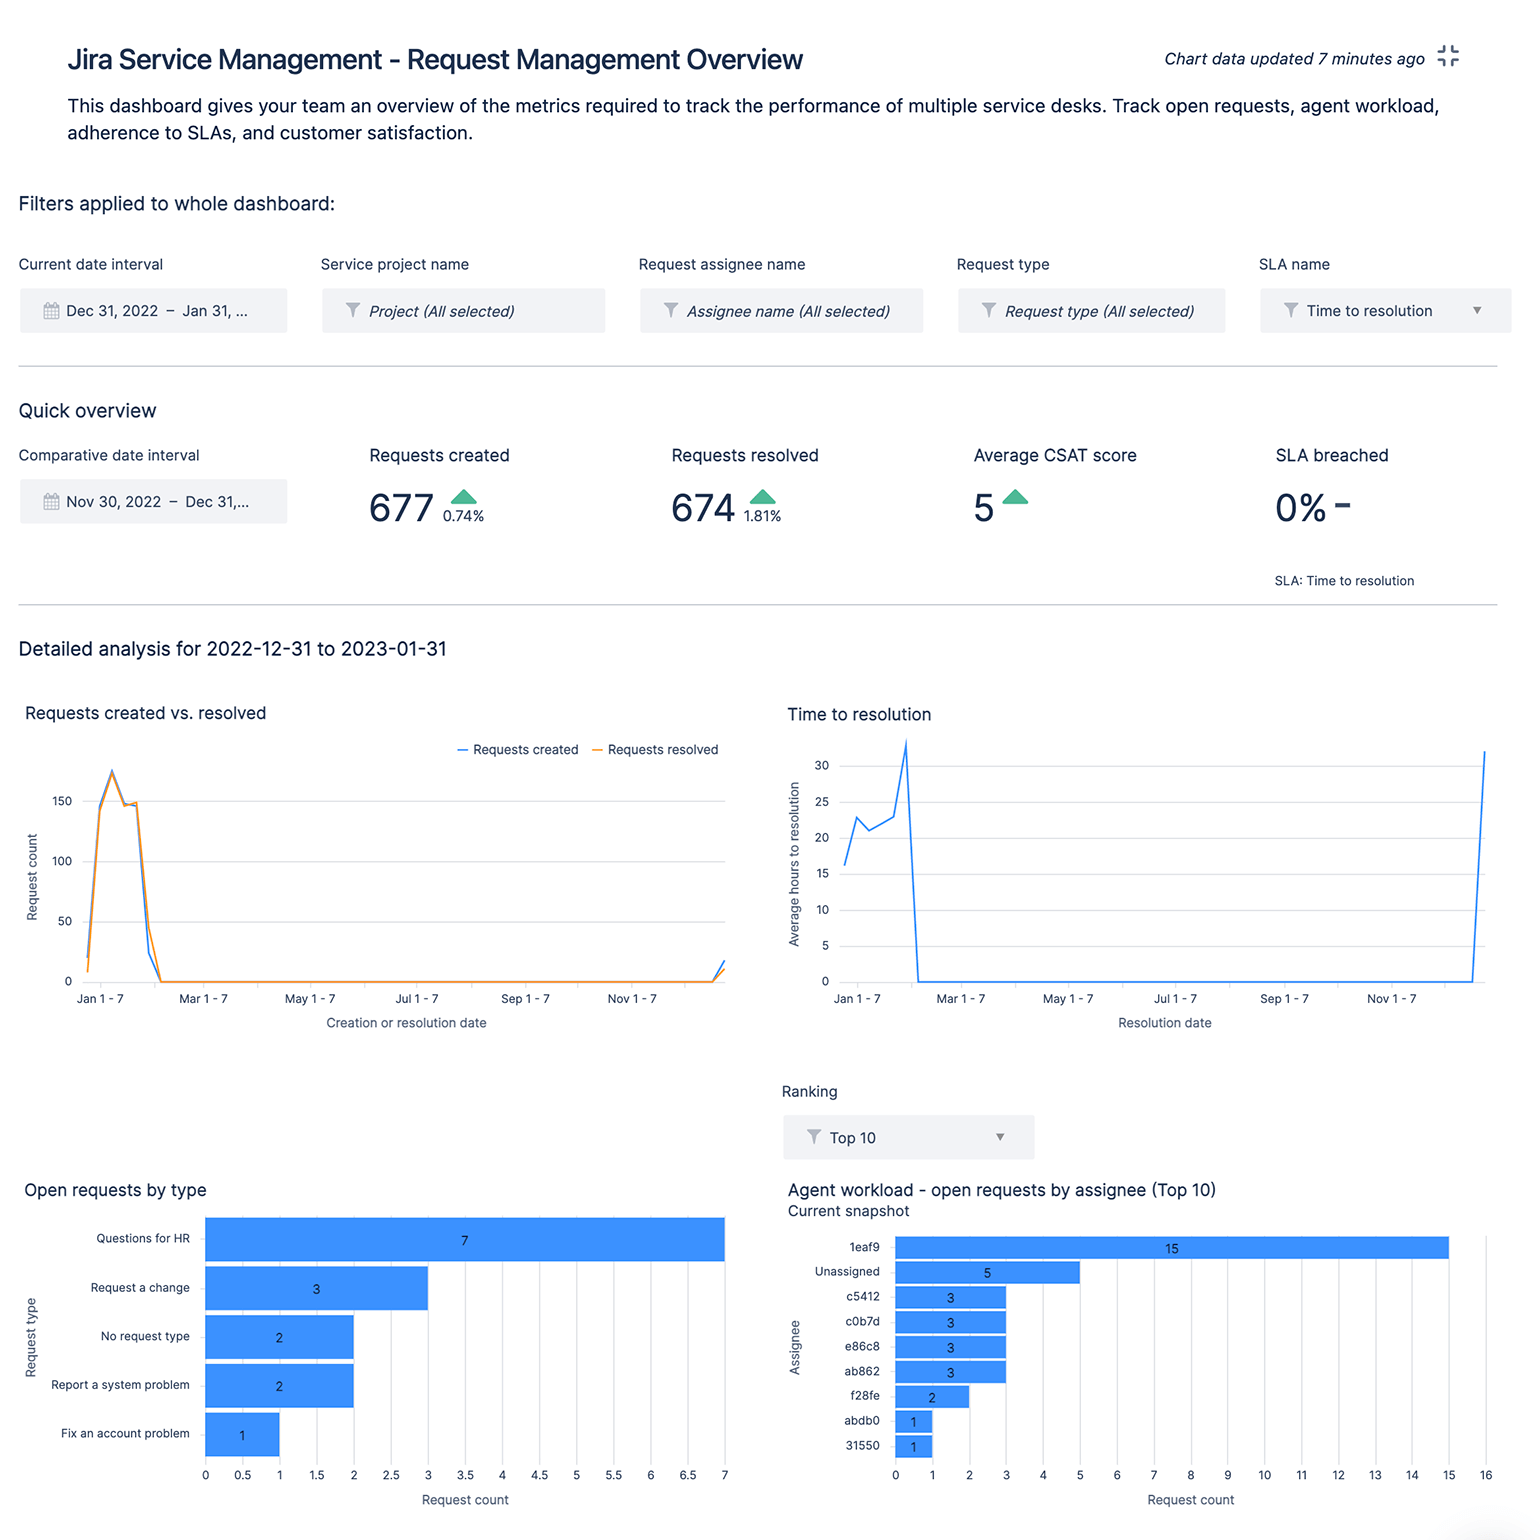
Screenshot of a request management dashboard
Business teams
Analyze content creation and management across Confluence sites. Track key metrics to understand the flow and usage of spaces, pages, and more.
- Get an aggregate view of total spaces, pages, blog posts and comments
- Understand adoption across your content by measuring metrics by space type
- Track status and freshness of your content by which pages have been updated recently and what their status is
- Gain insight into what topics teams are creating content for by drilling down into the top labels across your Confluence site
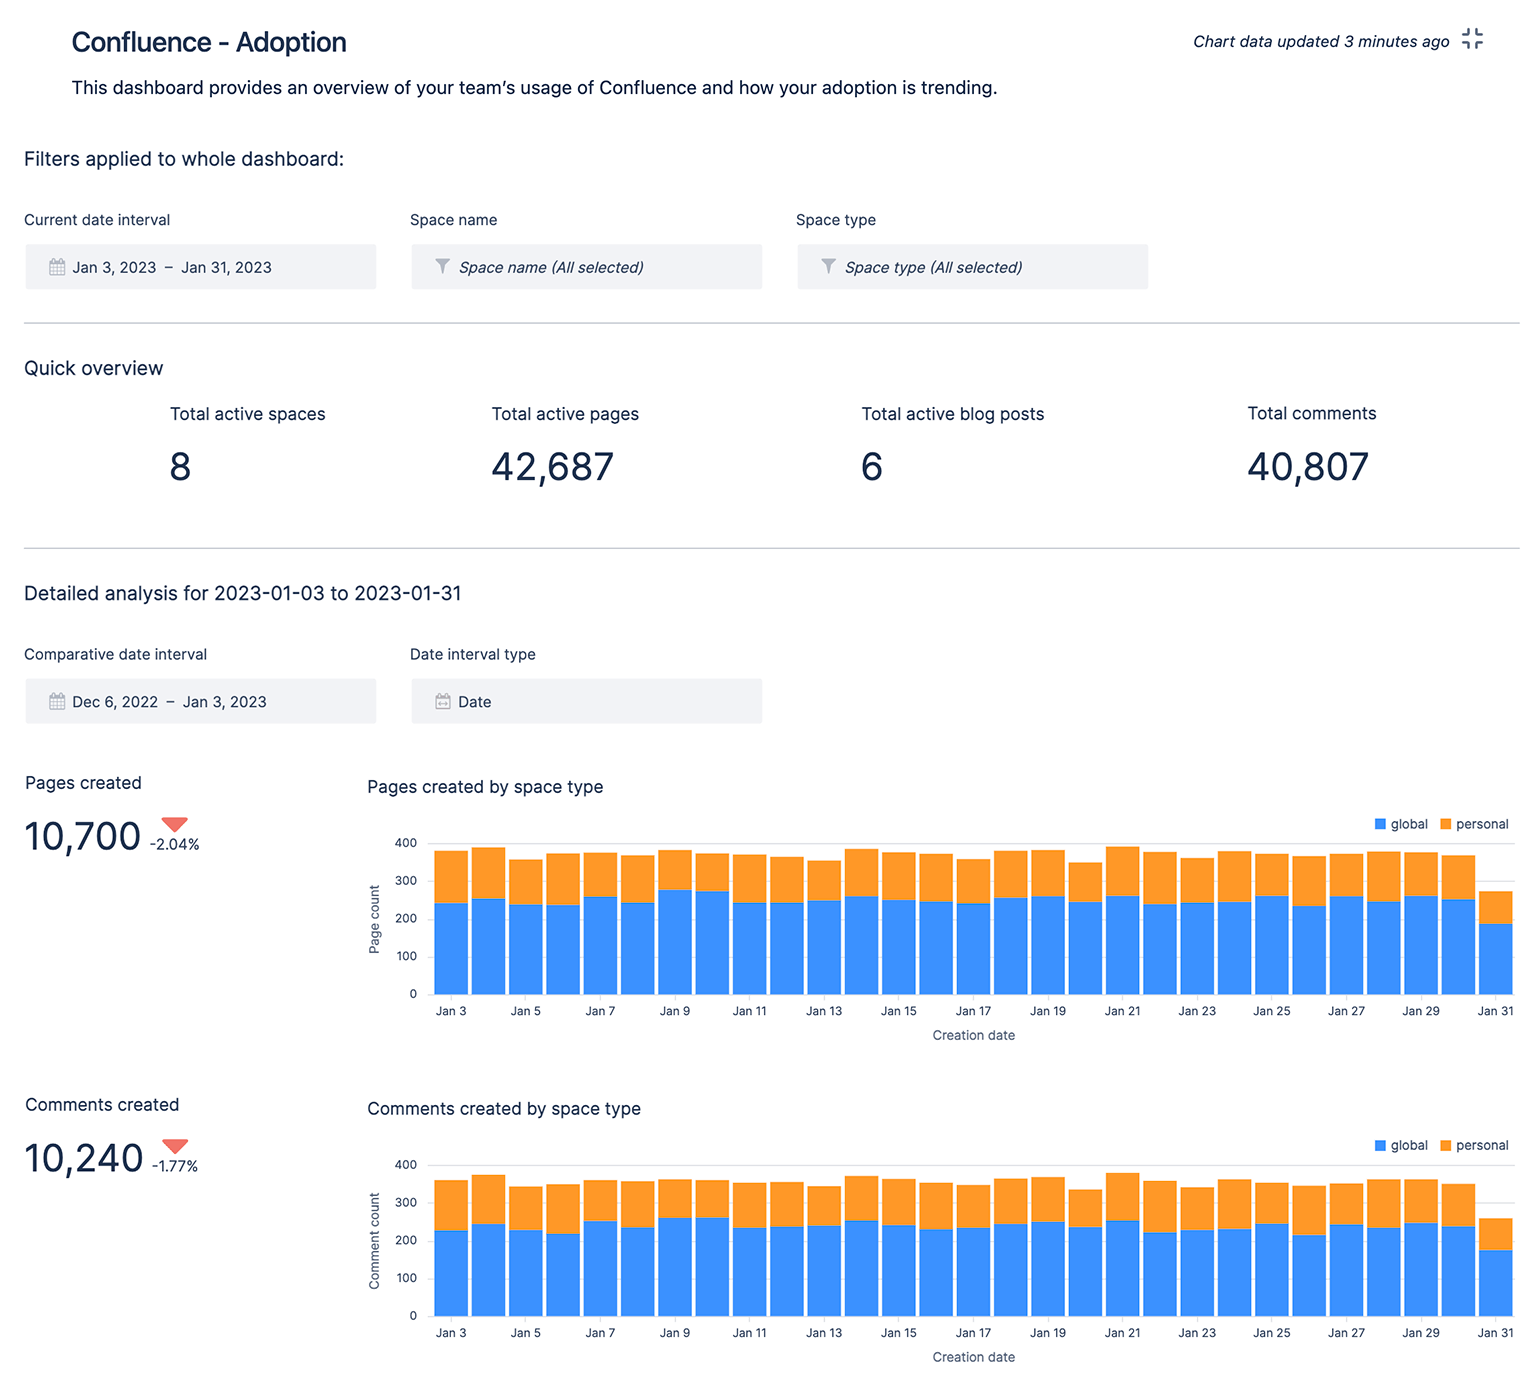
Screenshot of a Confluence adoption dashboard
How Atlassian Analytics works
Select your data sources
Select your data sources, Atlassian Analytics seamlessly connects to the Atlassian Data Lake and allows you to configure which products and instances you want to retrieve data from.
Choose to include or exclude projects (Jira Software, Jira Service Management, Opsgenie), assets, or spaces (Confluence).
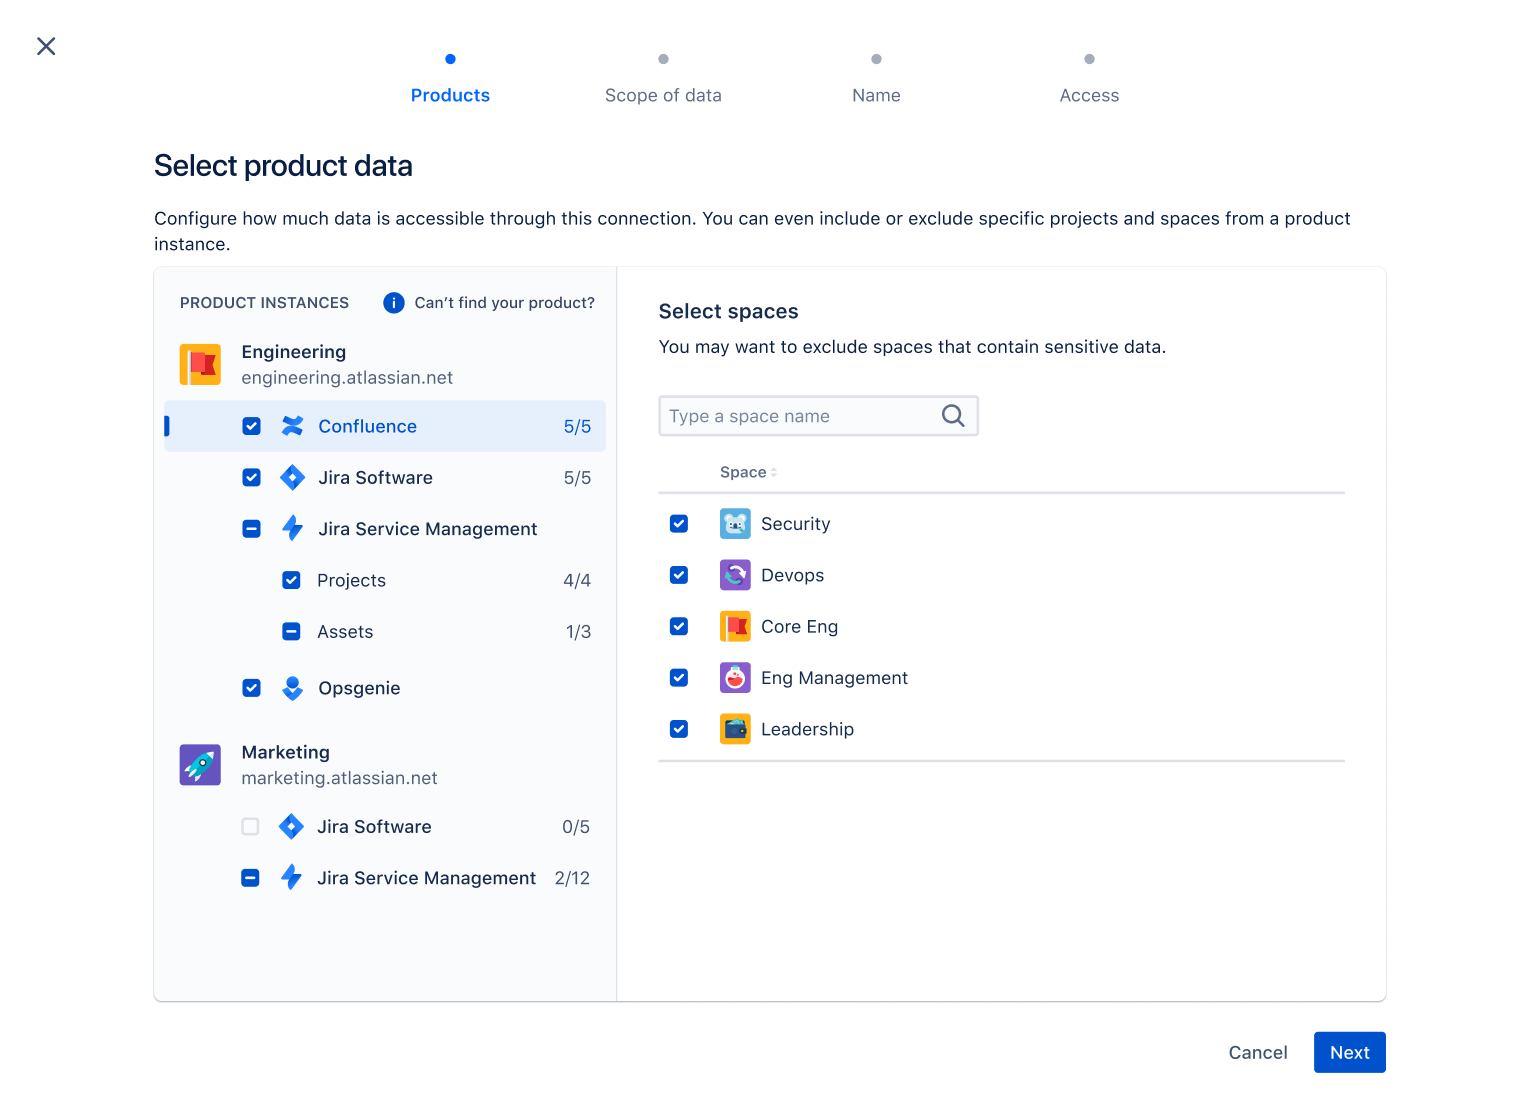
Product data selection screen
Start with pre-built templates
You can access a number of template dashboards and charts as soon as you create a connection to one of your product instances. These templates are designed to address the common needs of business and technical teams.
- Drill down to get insights on specific project timelines and bottlenecks
- Comment and share with key stakeholders to drive action
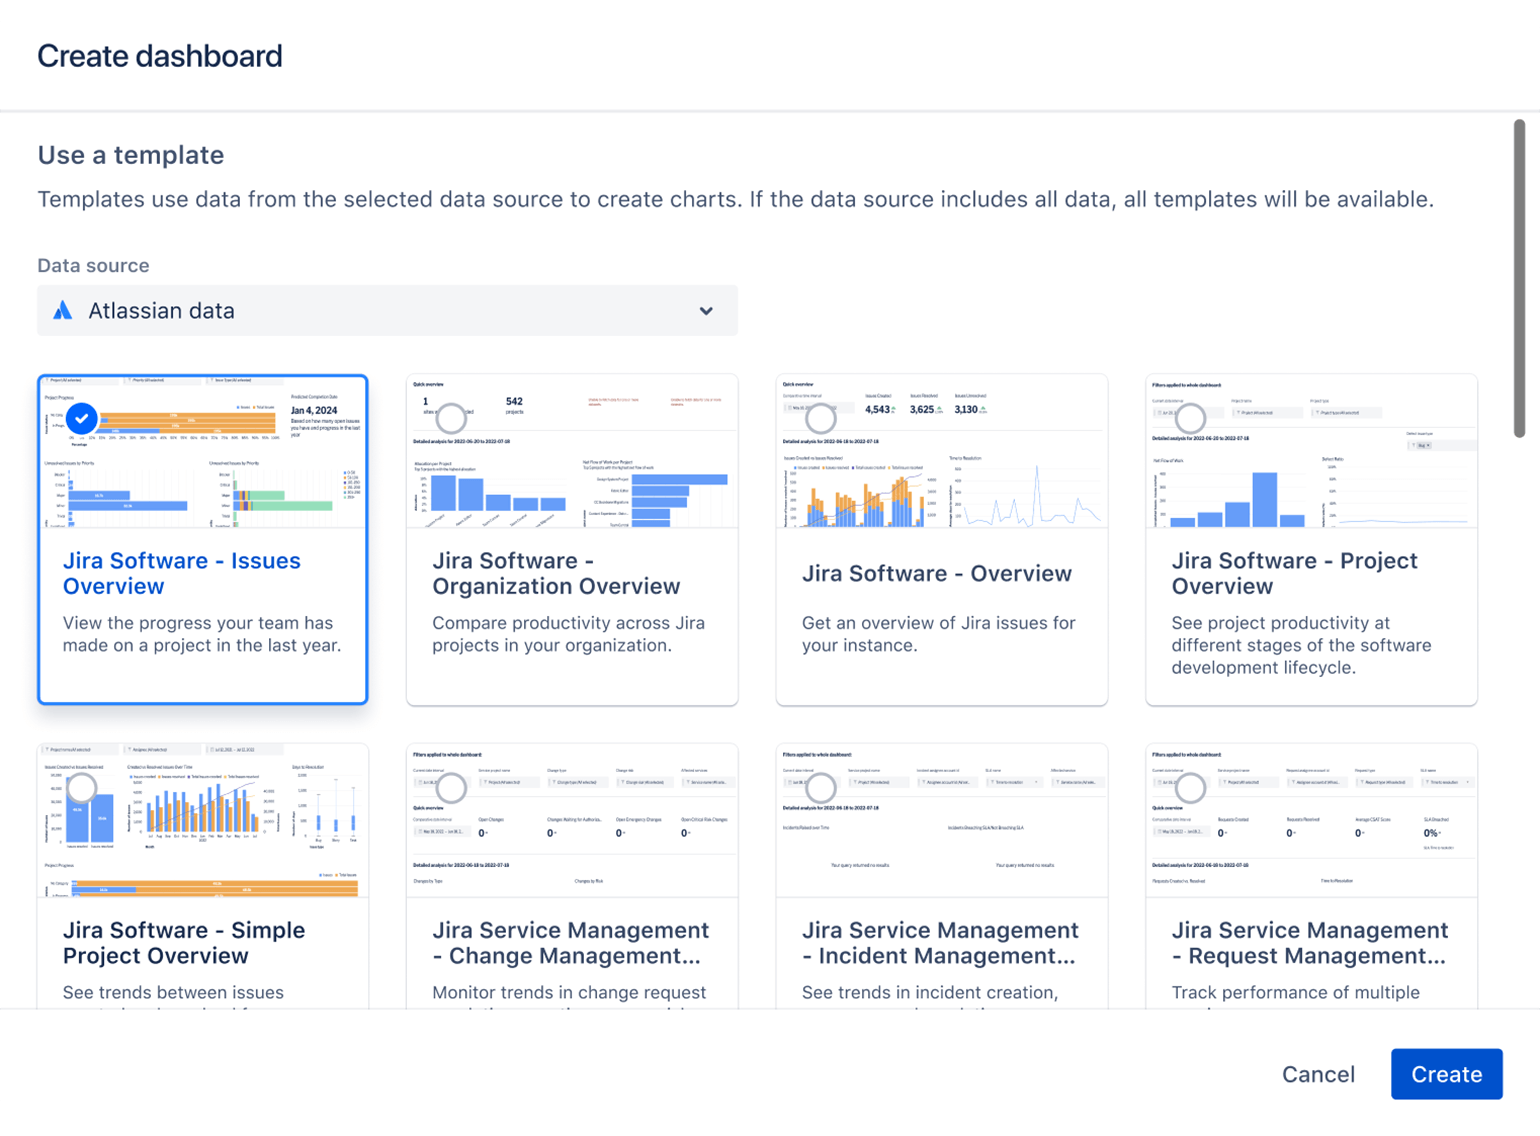
Screenshot of template dashboards available in Atlassian Analytics.
Run SQL your way
Create custom views across products or instances by running SQL queries directly against the Atlassian Data Lake. Users who are not familiar with SQL can use the visual query mode, which enables building custom charts and dashboards without writing any code.
Add columns and filters to generate new charts, utilizing intuitive joins between data sets. If desired, switch to written SQL to fine-tune queries and explore further details.
Animated screen showing the use of visual and written SQL queries
Explore multiple visualization options
Select the chart types and diagrams that best suit your visualization requirements. Atlassian Analytics recommends the most suitable chart type based on the structure of your queried and transformed data.
Animated screen demonstrating chart visualization options
Comment, download, and embed
Atlassian Analytics fosters collaboration through its interactive dashboards and charts. Users can comment on charts and tag their teams to initiate discussions. Dashboards and charts can also be shared using Smart Links, enabling analysis sharing with additional teams via Confluence pages.
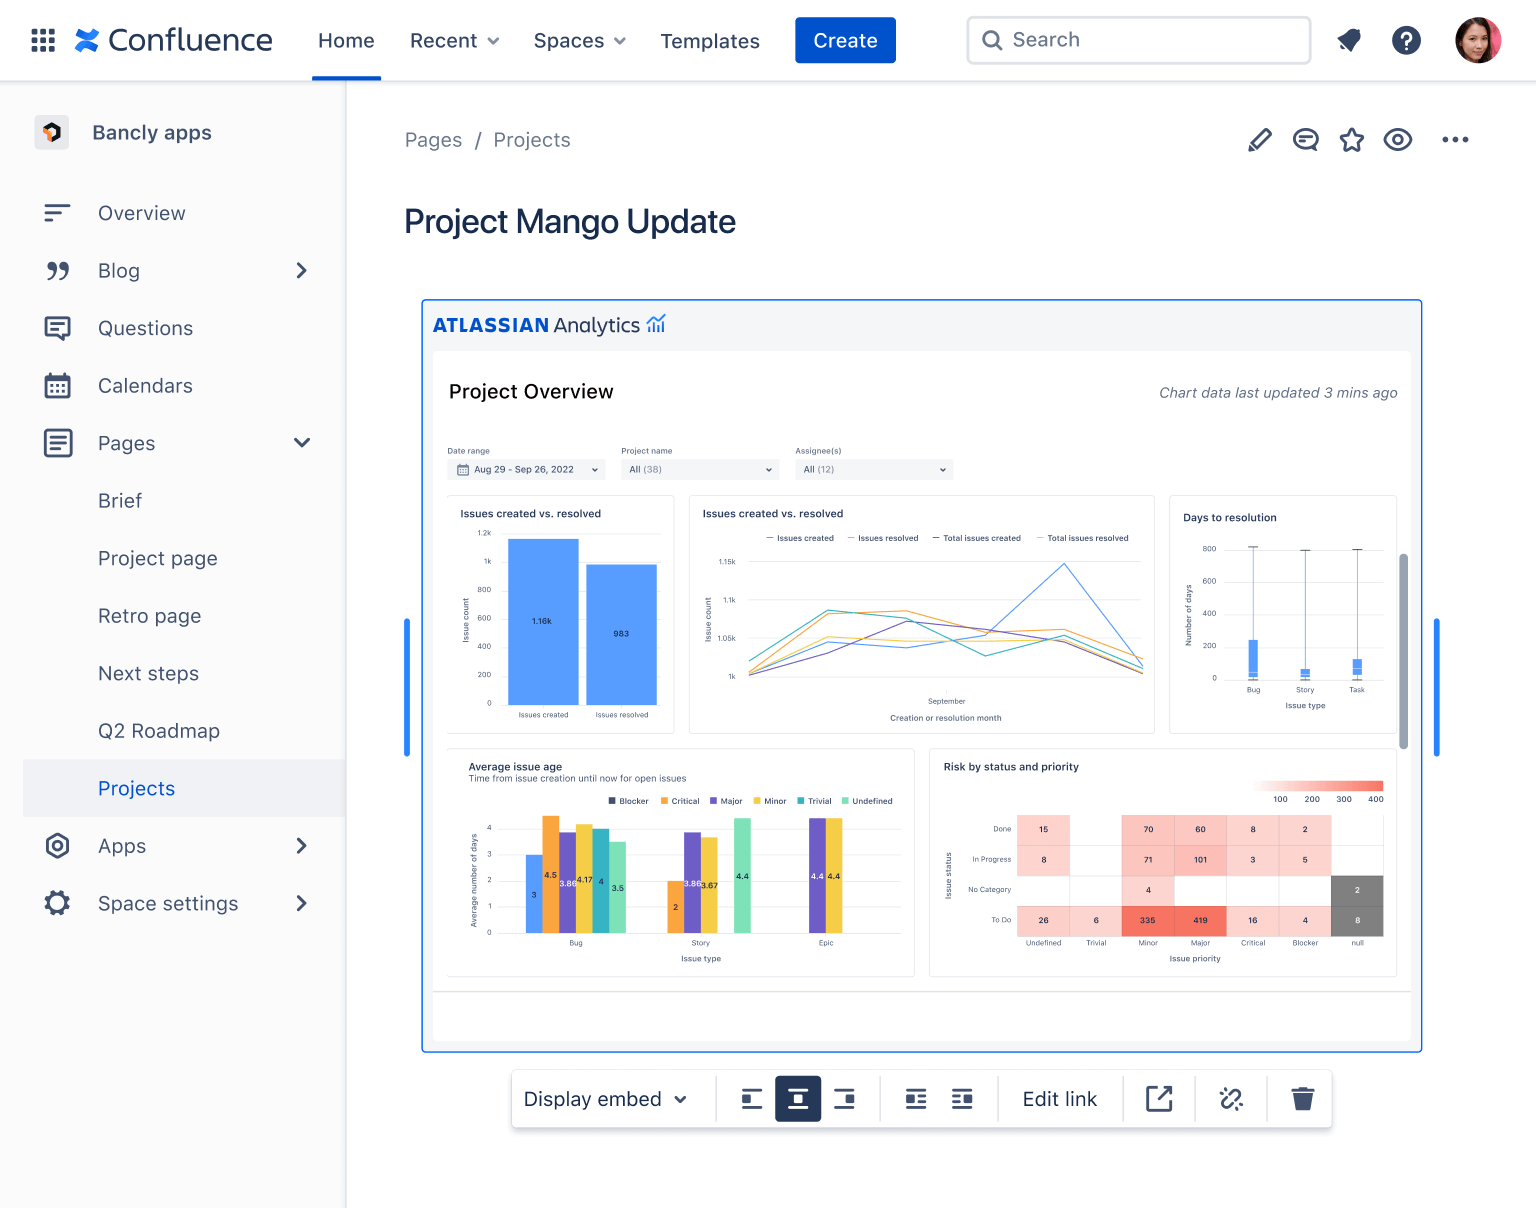
A dashboard embedded via a Smart Link into a Confluence page.