eazyBI: Powerful reports, dashboards and calculation in your Jira data
Use eazyBI to create powerful calculations, reports an dashboards quickly and easily.
Powerful Reporting
eazyBI is a powerful app for Jira to create reports, dashboards and charts by using the drag-and-drop-tool. This is how you can analyze and visualize your Jira issues data as well as additional data from CSV or Excel files, SQL and REST API data sources. eazyBI also supports Jira Software, Jira Service Desk and Tempo Timesheets custom fields, Xray, Zephyr and Adaptavist test management data.
eazyBI and catworkx
catworkx is a partner of eazyBI for Jira and is happy to support its customers in configuration or administration of it.
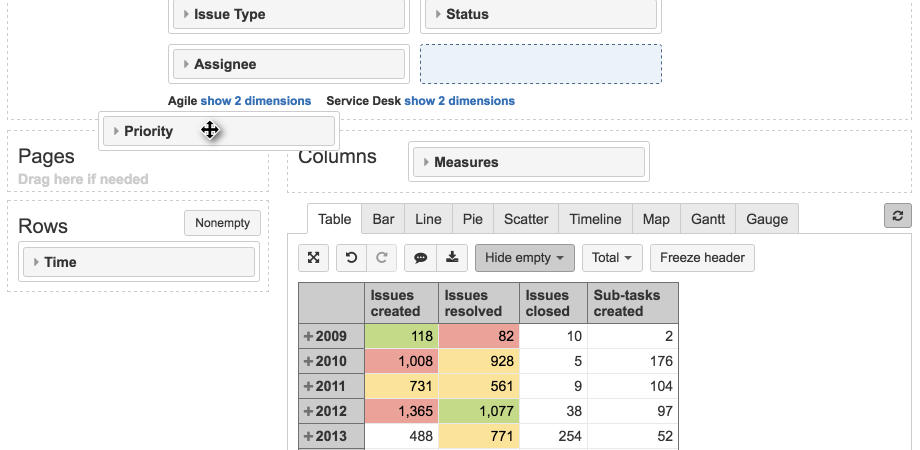
Easy drag-and-drop reports
You can easily create charts or pivot table reports from Jira standard by using a drag-and-drop interface. Of course, you can analyze your custom field dimensions and measures as well.
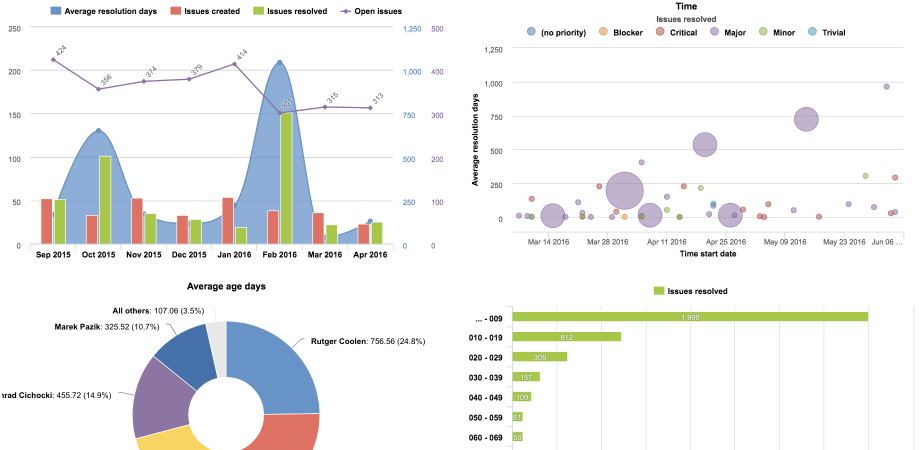
Many different chart types
eazyBI supports easy-to-use bar, pie, line, timeline, scatter, map, Gantt or gauge charts. Explore different interactive chart options with instant feedback.
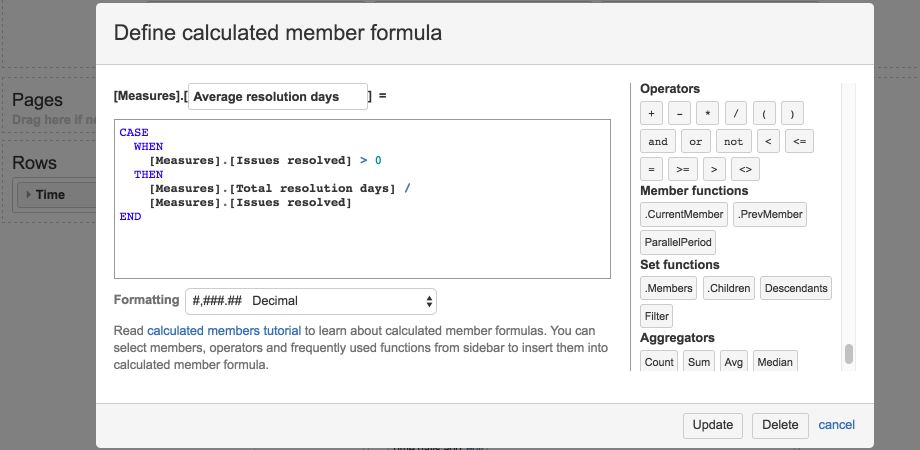
Powerful calculations
It is possible to define your own specific calculations by using custom calculation formulas or you can use one of many predefined calculated measures.
More details
Analyze Jira issues by standard and custom issue fields
Start from a summary overview and drill into details
Create pivot table reports, visualize your data with many chart types
Identify trends and top/bottom performers
Define your own measures and filters
Analyze third-party custom fields
Visualize historic data
Filter within your report or dashboard quickly and easily
Add different accounts for different projects and add account users
Add additional permissions than you defined in Jira
Publish eazyBI reports as gadgets on Jira dashboards
eazyBI also supports
Jira Software (Agile) custom fields (Sprint, Epic and Story Points)
Jira Service Desk custom fields (with SLA metrics)
Tempo Timesheets custom fields and worklog attributes